Abstract
Recent interest towards autonomous navigation and exploration robots for indoor applications has spurred research into indoor Simultaneous Localization and Mapping (SLAM) robot systems. While most of these SLAM systems use Visual and LiDAR sensors in tandem with an odometry sensor, these odometry sensors drift over time. To combat this drift, Visual SLAM systems deploy compute and memory intensive search algorithms to detect `Loop Closures’, which make the trajectory estimate globally consistent. To circumvent these resource (compute and memory) intensive algorithms, we present ViWiD, which integrates WiFi and Visual sensors in a dual-layered system. This dual-layered approach separates the tasks of local and global trajectory estimation making ViWiD resource efficient while achieving on-par or better performance to state-of-the-art Visual SLAM. We demonstrate ViWiD’s performance on four datasets, covering over 1500 m of traversed path and show 4.3x and 4x reduction in compute and memory consumption respectively compared to state-of-the-art Visual and Lidar SLAM systems with on par SLAM performance.
High Level Idea
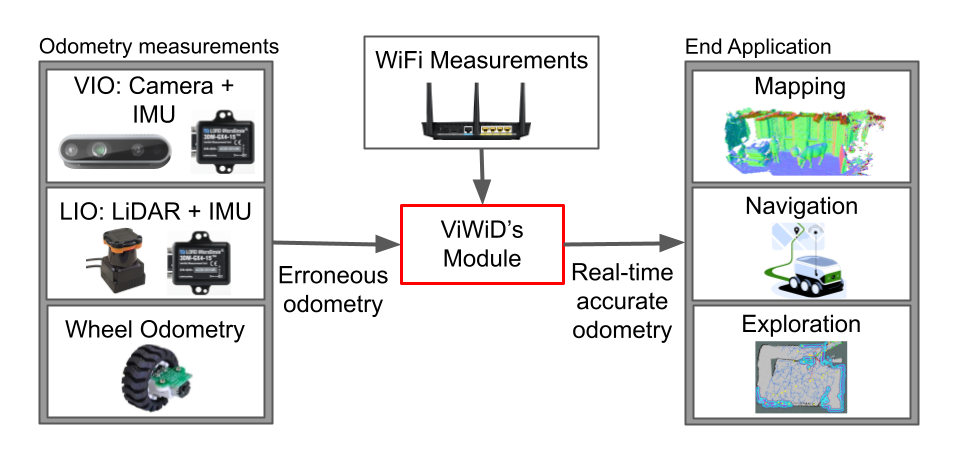
The core idea of ViWiD is to consider WiFi access points, deployed in the envrionment, as unique landmarks which can be leveraged to correct for drifts in the robot’s trajectory. A visualization of new AP’s discovered and added in an envrionment and appropriate corrections made to the trajectory, is provided under Quick Results. However, fusing new sensors in an existing SLAM system can be challenging, hence we provide a dual graph approach, where the inputs from any SLAM algorithm can be provided to the ViWiD ROS node for trajectory corrections. Consequently, ViWiD stands for Visual-WiFi dual graph and the above figure showcases a this process block diagram.
New Environment Added to P2SLAM Datasets!
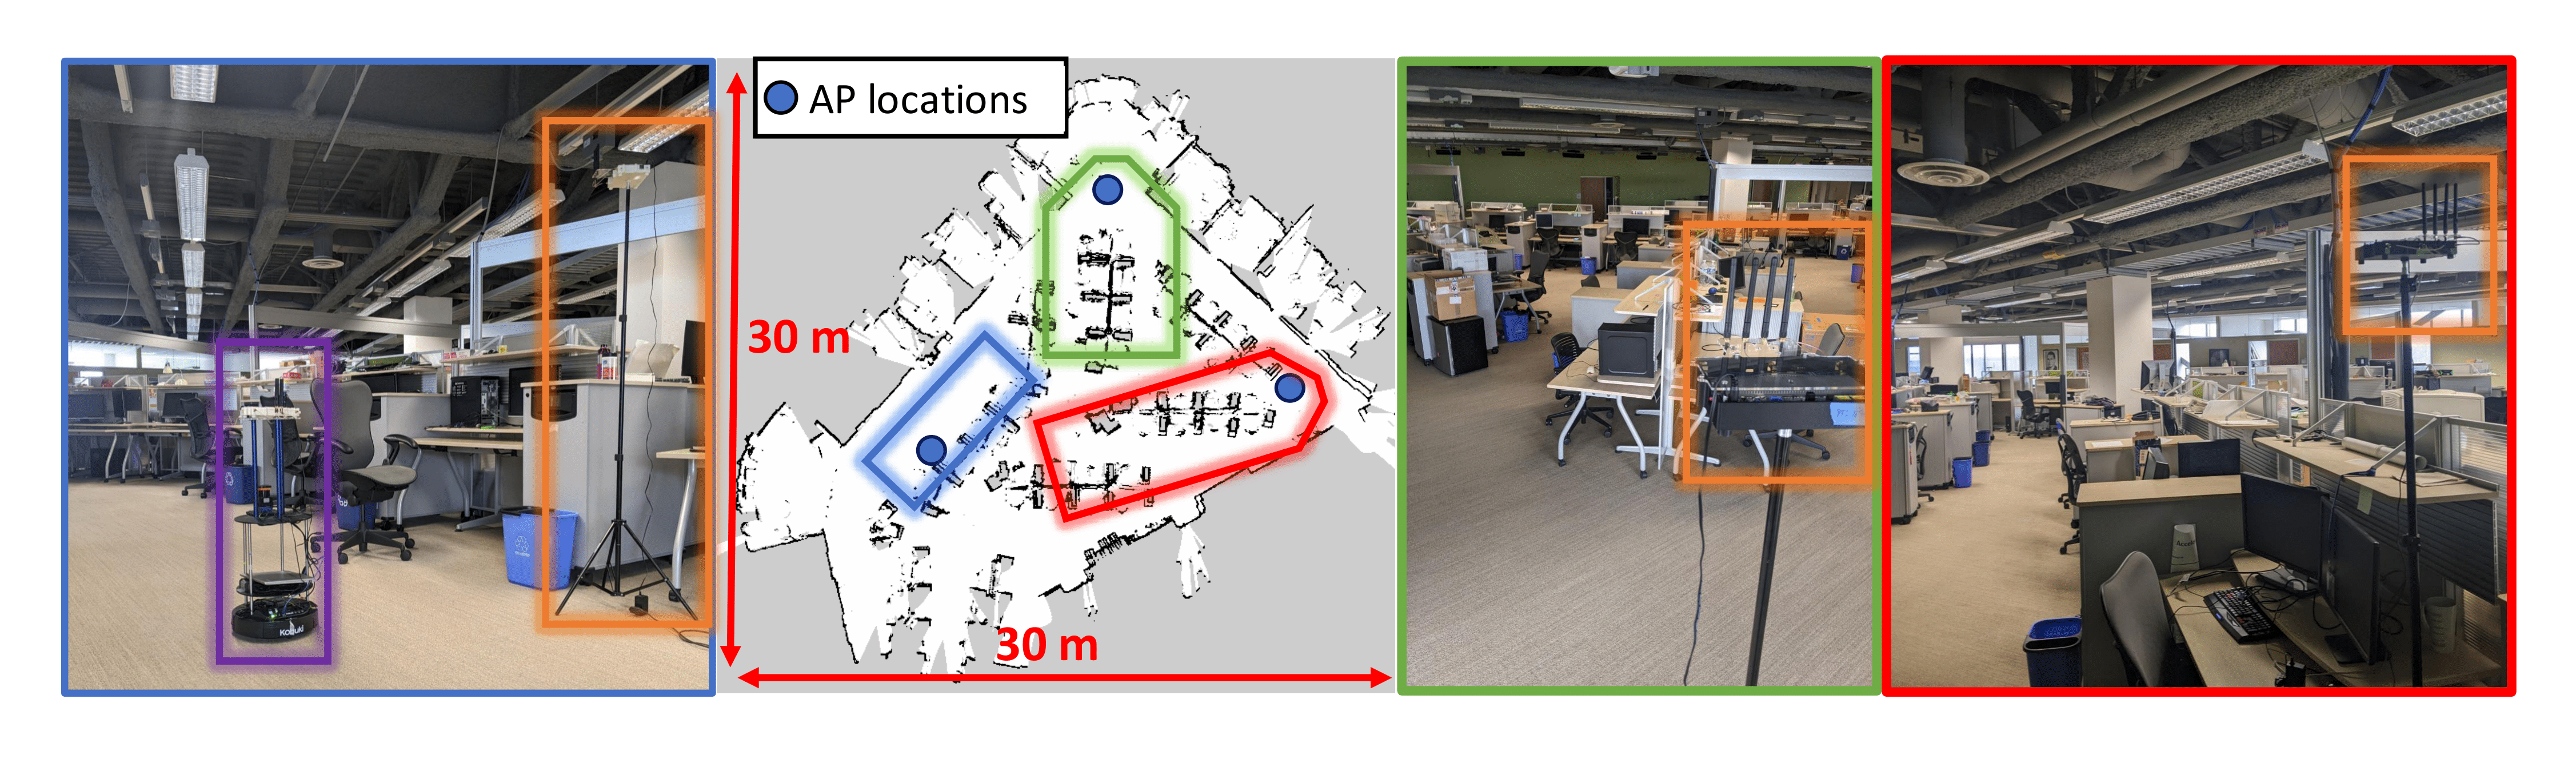
In addition to the environment described in P2SLAM, we have collected a new dataset in an office envrionment, with stereo camera data, IMU, Lidar, Wheel odometry and WiFi measurements. The purple box and orange boxes indicate the robot and the AP’s placed in the environment respectively. The colored boxes in the map correspond to the view points of the 3 images of the environment shown, color-matched to the edges of the respective images.